Leading Ground Cover Analysis

FARMMAP 4D NEWS & BLOG

11
November, 2021

Ground cover analysis is a critical area for sustainable farm management practices.

Even more so today, with increasingly extreme and prolonged weather events, a push to capture soil carbon and growing demand for the products you produce. We believe our Times Series Satellite Imagery tools will give you a big prop in this area to better understand the health of your land and manage better outcomes.

Our analysis tools go a layer deeper and more insightful than traditional vegetation indices like the NDVI with the inclusion of Fractional Cover and Fractional Ground Cover imagery. This separates the tree canopy cover from the more relevant on-the-ground vegetation cover.

 The data is also divided into green vegetation, non-green (or dry) vegetation and bare ground. This gives a more complete picture of total vegetation cover on your property – particularly in dryer areas of the country where non-green cover will be more prevalent.

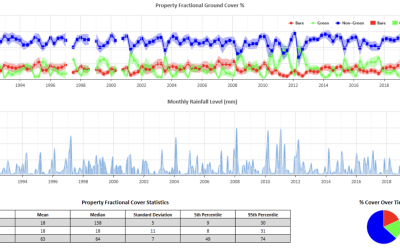
This popular tool allows you to select the total property, a specific paddock or paddocks, a land type on your property, or a selected area of your property and analyse the fractional cover or fractional ground cover over 30 years of satellite imagery. The results are divided into percentage green cover, non-green cover and bare ground on a quarterly basis to show seasonal change in vegetation cover performance. We also include accompanying rainfall levels to determine if other factors besides precipitation had a bearing on ground cover levels.

This analysis is available in our Standard and Premium Subscriptions.

Click here to discover a FarmMap4D subscription that will work for your property.

Growing Need for ESG Compliance

Growing Need for ESG Compliance

Growing need for ESG compliance   A key area FarmMap4D has been designed for, is to address the growing need for ESG risk management compliance in the rural community. By leveraging satellite imagery and rainfall data, FM4D's unique imagery analysis tools offer a...

read more
Custom Map Creation with layers

Custom Map Creation with layers

Did you know, you can easily create custom maps with multiple layers overlayed on one another and visible all on the one map? With all Farmmap4D subscriptions, you can easily modify the opacity/transparency of each visible layer so you can visualise multiple layers of...

read more
Unique Regional Cover Analysis

Unique Regional Cover Analysis

One of FarmMap4D’s unique ground cover tools is the Regional Cover Analysis. The benchmarking tool is an extension of our Basic Statistics tool which allows the analysis of green and non-green vegetation cover over time. Regional Cover Analysis takes it a step...

read more
EYCI ends on a high

EYCI ends on a high

In a record-breaking month for the Eastern Young Cattle Indicator (EYCI), the year ends on-trend and on a high for the cattle and sheep market. In the cattle market particularly, records have been continually broken throughout 2021, finishing at 1169.22c, up a huge...

read more
Profiling Tool added as Standard

Profiling Tool added as Standard

One of our most popular mapping programs, “the Profiling Tool”, has been added to the FarmMap4D Standard product. The unique topographic tool allows you to overlay a directional line anywhere across your mapped property and calculate a vertical cross-section of the...

read more
Business as Usual

Business as Usual

FarmMap4D Monthly News, July 2021 Over the course of the past month, many parts of Australia have found themselves in lockdown. Luckily for many of us, the restrictions don't have a large impact on our day-to-day lives and business continues as usual. The business of...

read more
Maps save mistakes

Maps save mistakes

Knowledge of a property, the different paddocks and boundaries is built up over time, sometimes generations. This can lead to misunderstandings – wrong mob of sheep drenched, cattle moved to the wrong paddock, fencing contractors working in the wrong place, rippers...

read more
Out and about at long last!

Out and about at long last!

This month Kate headed off to Hawker and Wudinna in her home state of SA to talk farm mapping and ground cover analysis with farmers and graziers at a couple of Livestock Technology Field Days hosted by the PIRSA Red Meat and Wool Growth Program. How refreshing for...

read more
Red Meat and Wool Livestock Tech Expos

Red Meat and Wool Livestock Tech Expos

Improve your productivity and profitability with tech If you're looking to improve productivity and profitability through technology and data, head to Primary Industries and Regions SA's Livestock Technology Expo. Make sure you come and have a chat - we'll be there...

read more